Ethereum Price Analysis 2026: Is ETH Undervalued at $2,200?
Ethereum Price Analysis & Outlook 2026: On-Chain Data, Catalysts, and Scenarios
Last updated: April 13, 2026 | ETH: ~$2,200 | Down 55% from ATH | Fear & Greed: 15 (Extreme Fear)
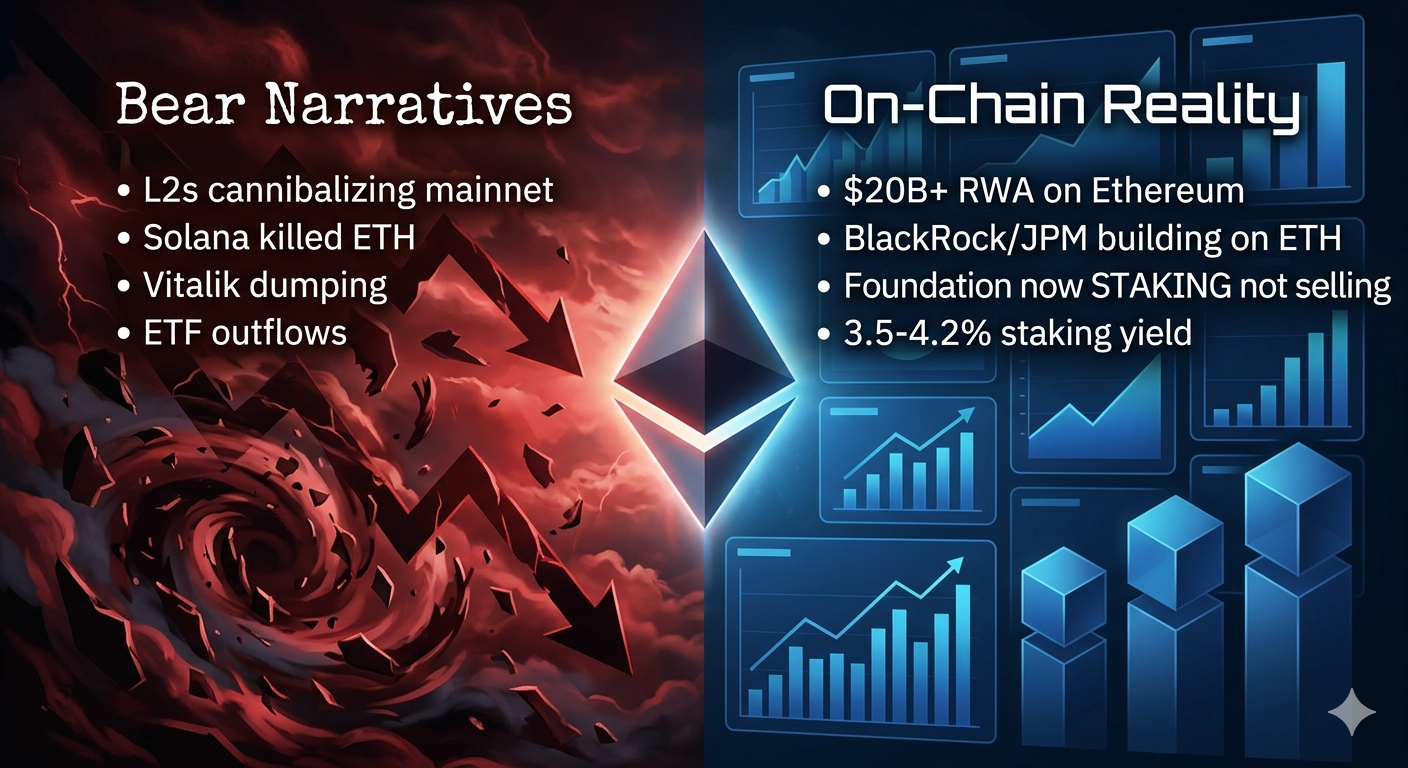
Ethereum is the most hated major crypto asset right now — and that alone makes it worth a serious look. ETH collapsed from its August 2025 all-time high of $4,955 to below $1,800 in February 2026, a 64% drawdown. It’s now recovering in a choppy $2,000–$2,400 range while the narrative around it has turned relentlessly bearish: “Layer 2s are cannibalizing mainnet revenue.” “Solana killed Ethereum.” “Vitalik is dumping.”
Yet underneath the noise, Ethereum still anchors the majority of DeFi’s total value locked, hosts the largest smart contract developer ecosystem, and is the blockchain of choice for over $20 billion in real-world asset (RWA) tokenization. BlackRock, JP Morgan, and major financial institutions are building on Ethereum — not Solana, not anything else.
This analysis cuts through the narratives and examines what the data actually says: the on-chain metrics, the technical structure, the upcoming catalysts, and the realistic scenarios for ETH through the rest of 2026.
Where Ethereum Stands: April 2026 Snapshot
| Metric | Value |
|---|---|
| Current Price | ~$2,200 |
| All-Time High | $4,955 (Aug 24, 2025) |
| Decline from ATH | ~55% |
| Market Cap | ~$265 billion |
| Staking Yield | 3.5–4.2% APR |
| Monthly Performance (March) | First green month since Aug 2025 |
| ETH/BTC Ratio | Near multi-year lows |
| RSI (Daily) | ~39–57 (neutral to near-oversold) |
| 200-Day SMA | ~$2,130 — price hovering around it |
March 2026 broke a six-month losing streak with ETH’s first positive monthly close since August 2025. But the gains remain modest, and the technical picture is uncertain. ETH is sitting right at its 200-day SMA — a critical level that will determine whether this is the start of recovery or just a dead cat bounce before another leg down.
What Happened: The Timeline of Ethereum’s Decline
Understanding how we got here provides context for where we might go:
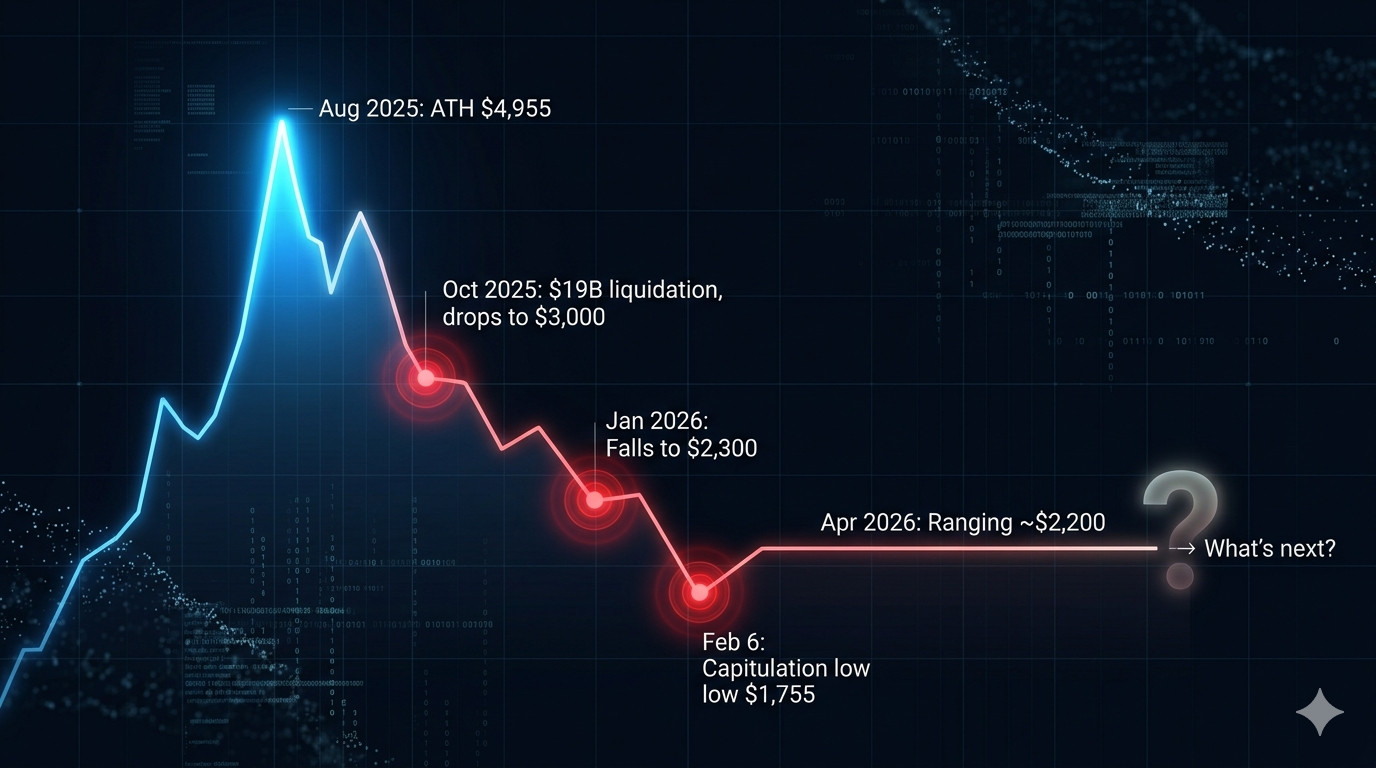
August 2025: New ATH at $4,955. Ethereum reached a new all-time high, surpassing the November 2021 peak of $4,878. Strong DeFi activity, NFT recovery, and the Pectra upgrade (May 2025) drove the rally.
September–October 2025: The unraveling. The broader crypto market collapsed alongside the October tariff shock and $19 billion liquidation cascade. ETH dropped from ~$4,500 to below $3,000. The ETH/BTC ratio began its decline as capital rotated into Bitcoin.
November–December 2025: Narrative collapse. Vitalik Buterin sold ETH, sparking negative sentiment. ETH ETF outflows began. The “Solana killed Ethereum” narrative gained traction on social media. ETH fell to ~$2,900 by year-end.
January 2026: $3,500 to $2,300. ETH began the year near $3,100–$3,500 before a sharp selloff drove it to $2,300 by month-end. Recession fears, Iran-U.S. tensions, and risk-off sentiment across all markets accelerated the decline.
February 2026: The capitulation. ETH crashed from $2,270 to a low near $1,755 on February 6 — a 49% drop from January highs. This was the sharpest monthly decline since 2022. Leveraged positions were liquidated en masse.
March–April 2026: Stabilization. ETH has been building a base in the $2,000–$2,400 range. March closed green — the first positive month in seven. The Ethereum Foundation staked 45,000 ETH in a single day in early April, directly reducing sell pressure and signaling institutional confidence.
The Bearish Narrative vs. The Data
The current consensus on Twitter is that Ethereum is finished. Let’s examine each bearish argument against the actual data:
“Layer 2s are cannibalizing Ethereum”
The narrative: Base, Arbitrum, Optimism, and other L2s are processing most transactions now, taking fees away from Ethereum mainnet and reducing ETH burn.
The reality: L2s are Ethereum’s scaling solution, not its competition. Every L2 transaction ultimately settles on Ethereum mainnet and pays fees to do so. L2 growth increases the total addressable market for the Ethereum ecosystem. Think of it like a shopping mall (Ethereum) that builds more floors (L2s) — the mall gets more valuable, not less. The data supports this: Ethereum’s total ecosystem TVL (mainnet + L2s) is larger than ever.
“Solana killed Ethereum”
The narrative: Solana is faster, cheaper, and attracting more users. Ethereum is losing the L1 race.
The reality: Solana excels in retail activity, meme coins, and high-frequency trading. Ethereum dominates in institutional DeFi, RWA tokenization ($20B+ on Ethereum), and enterprise infrastructure. BlackRock chose Ethereum for its tokenized money market fund. JP Morgan uses Ethereum L2s for settlement. These aren’t decisions that reverse easily. Both chains can coexist — they serve different markets.
“Vitalik is dumping”
The narrative: The Ethereum Foundation and Vitalik sell ETH regularly, undermining confidence.
The reality: The Ethereum Foundation recently reversed course. In early April 2026, they staked 45,000 ETH in a single day instead of selling to fund operations. This directly reduces circulating supply and sell pressure. The market noticed — ETH rallied on the news.
“ETH ETFs are bleeding”
The narrative: Ethereum ETFs have seen five consecutive months of outflows. Nobody wants ETH exposure.
The reality: This is true and is the most legitimate concern. Unlike Bitcoin ETFs (which have $58B+ in AUM), ETH ETFs have struggled to attract sustained inflows. However, staking ETFs from BlackRock and Grayscale launched in early 2026 — the first time institutional investors can get yield-bearing crypto exposure through regulated products. If these gain traction, the flow dynamic could reverse rapidly.
On-Chain Fundamentals: What ETH Holders Are Doing
Price tells you where Ethereum has been. On-chain data tells you where it might go:
Whale accumulation is mixed but noteworthy. The two largest whale cohorts (wallets holding 100K–1M ETH and 1M–10M ETH) increased their supply share from mid-March through March 25. The larger group went from 8.07% to 8.22%, the smaller from 13.19% to 13.53%. However, both cohorts began trimming in the final days of March — a reversal that bears watching closely. When whale accumulation stalls, it thins the demand side at precisely the wrong moment.
Staking continues to lock supply. ETH staking yield remains stable at 3.5–4.2% APR. Every ETH staked is effectively removed from liquid supply. With the Ethereum Foundation now staking rather than selling, the net supply reduction is accelerating. Staking provides what is essentially a “risk-free rate” for the Ethereum ecosystem — a fundamental floor that other L1s don’t have.
EIP-1559 burn is active but muted. The fee burn mechanism still removes ETH from circulation with every transaction. During high network activity, more ETH is burned than created through staking rewards — making ETH deflationary. The problem: network activity has been depressed in the bear market, so the burn rate is low. When DeFi usage recovers, this dynamic flips, and it flips hard.
Hodler conviction is weakening. The hodler net position change metric has been declining steadily — a pattern that preceded the February crash. If this turns negative in April, it signals that long-term holders are losing patience, which historically precedes further downside. This is the single most important on-chain metric to watch for ETH right now.
Upcoming Catalysts: What Could Move ETH
| Catalyst | Impact | Timeline |
|---|---|---|
| Glamsterdam Upgrade | Smart Accounts (account abstraction), MEV resistance via embedded PBS. Makes ETH wallets as easy as banking apps. | H1 2026 |
| Hegota Upgrade | Verkle Trees to reduce state bloat. Improves validator efficiency and node accessibility. | H2 2026 |
| Staking ETF traction | If BlackRock/Grayscale staking ETFs attract significant inflows, reverses the ETF bleed narrative. | Ongoing |
| RWA tokenization growth | Already $20B+ on Ethereum. Each new institutional deployment strengthens the moat. | Ongoing |
| Iran-U.S. ceasefire | Risk-on rally — ETH typically outperforms BTC in risk-on moves due to higher beta. | Days to weeks |
| Fed rate cuts | Liquidity expansion → DeFi activity recovery → more ETH burn → deflationary dynamics return. | Q2-Q3 2026 |
| Ethereum Foundation staking | 45K ETH staked in April. Signals shift from sell-to-fund to stake-to-fund. Reduces structural sell pressure. | Completed |
The upgrade pipeline is important: Ethereum has shipped on schedule for two consecutive upgrades (Pectra in May 2025, Fusaka in December 2025). This execution track record matters when pricing in future upgrade catalysts — these are real deliverables, not just roadmap promises.
Technical Analysis: Key Levels
For a comprehensive guide on how to read these charts, see our technical analysis guide. Here are the critical levels for ETH:
Support:
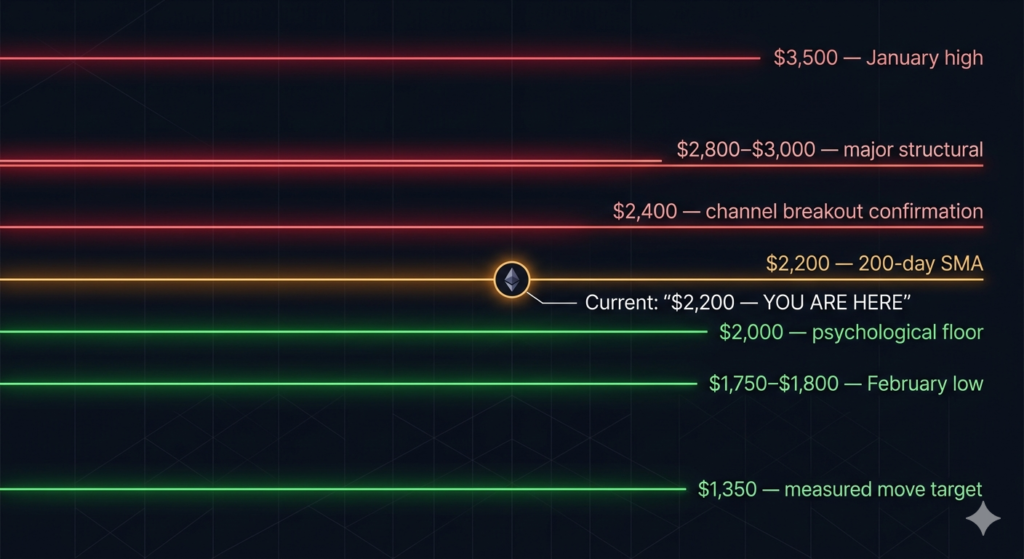
- $2,000: Psychological level and the boundary that held since the February capitulation. A sustained break below $2,000 risks repeating the February playbook — a 46% decline that took ETH to $1,755.
- $1,750–$1,800: The February low. This is the capitulation floor. A retest of this zone would coincide with extreme oversold conditions and likely trigger heavy accumulation.
- $1,350: The measured target if the $2,000 breakdown plays out fully (based on the ascending channel breakdown pattern on the 3-day chart). This level hasn’t been seen since mid-2023 and would represent a 73% drawdown from ATH.
Resistance:
- $2,200: Immediate resistance and the 200-day SMA area. A 3-day close above $2,200 is the minimum needed to keep the April outlook constructive.
- $2,390–$2,400: The upper trendline of the ascending channel. A close above this level converts the pattern from bearish continuation to genuine reversal. This is the “all clear” signal for bulls.
- $2,800–$3,000: Major structural resistance from late 2025. Breaking through here would confirm a new bull phase for ETH.
- $3,500: The January 2026 high. Reclaiming this level puts the ATH back in the conversation.
Three Scenarios for Ethereum in 2026
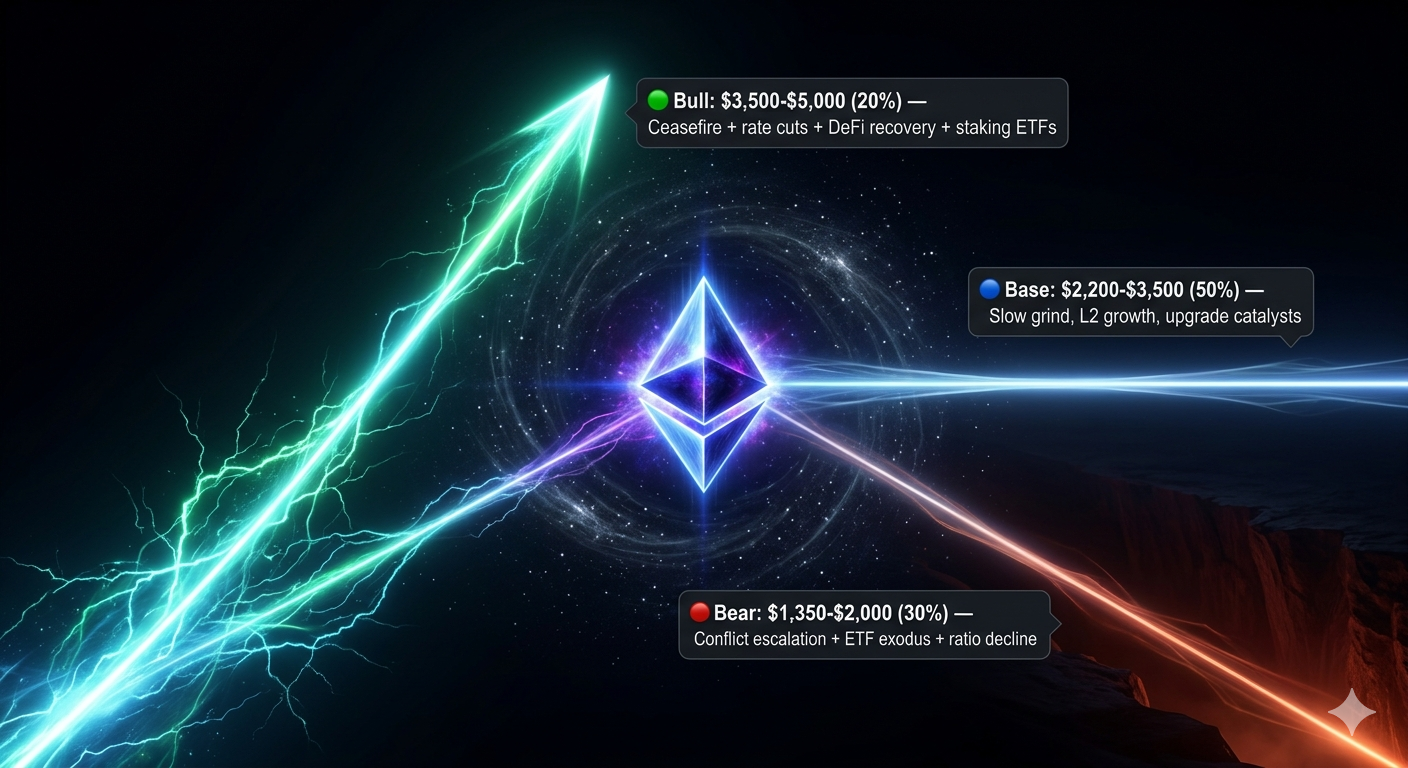
Bull Case: $3,500–$5,000 (Probability: ~20%)
Requirements: Iran-U.S. ceasefire → Fed rate cuts → DeFi activity recovery → EIP-1559 burn rate spikes → ETH becomes deflationary again → staking ETFs attract significant inflows → Glamsterdam upgrade ships on time and drives adoption → ETH breaks $2,400 → $3,000 → momentum carries to $3,500+.
In the most optimistic scenario, ETH could retest or exceed its $4,955 ATH. AI models from ChatGPT, Grok, and Perplexity give bull-case estimates ranging from $6,250 to $9,000 — but these require everything to go right simultaneously. The $3,500–$5,000 range is more realistic even in the bull case.
Base Case: $2,200–$3,500 (Probability: ~50%)
Requirements: Geopolitical situation stabilizes without full resolution → macro stays neutral → ETH continues ranging and slowly grinds higher → staking ETFs provide modest support → L2 activity grows → ETH ends the year somewhere in the $2,800–$3,500 range.
This is the “grind” scenario. No dramatic crash, no euphoric rally. ETH slowly rebuilds as DeFi usage returns and institutional infrastructure expands. Multiple analyst forecasts cluster around $2,800–$3,500 for end of 2026.
Bear Case: $1,350–$2,000 (Probability: ~30%)
Requirements: Conflict escalates → Fed forced to hike → recession hits → DeFi usage stays depressed → ETH ETF outflows accelerate → hodler conviction breaks → ETH loses $2,000 support → cascading liquidations push toward $1,800 or even $1,350 measured move target.
Note the bear case probability for ETH (30%) is higher than for Bitcoin (25%) in our BTC analysis. ETH carries additional narrative risk — the “Ethereum is dead” story could become self-fulfilling if institutional capital continues to prefer BTC. The ETH/BTC ratio at multi-year lows reinforces this concern.
ETH vs. BTC: The Ratio Problem
The ETH/BTC ratio has been declining consistently since the Merge in September 2022. This means ETH has been underperforming BTC on a relative basis for over three years. For investors choosing between the two, this matters:
If the ratio continues declining, you’re better off holding BTC. Every dollar in ETH would have performed better in BTC.
If the ratio reverses, ETH becomes the higher-beta play with more upside. Historically, the ETH/BTC ratio recovers during the “altcoin season” phase of a cycle — when capital rotates from BTC into alts.
The contrarian argument: the ETH/BTC ratio at multi-year lows represents maximum pessimism. Sentiment extremes tend to mark turning points. But “the market can stay irrational longer than you can stay solvent” — don’t bet the farm on a ratio reversal without confirmation.
Practical advice: If you’re building a bear market position, allocate more heavily to BTC (the safer choice) and use ETH as a smaller, higher-upside position. Our best crypto to buy analysis recommends 30-50% BTC and 15-25% ETH in the current environment.
Investment Thesis: Why ETH at $2,200 Might Be Undervalued
Strip away the narratives and look at what Ethereum actually is in April 2026:
It’s the world’s largest programmable blockchain with a $265 billion market cap. It hosts over $20 billion in tokenized real-world assets. Major financial institutions are actively building on it. It has a working yield mechanism (3.5-4.2% staking APR). It has a fee-burn mechanism that makes it deflationary during high usage. It has two upgrades scheduled for 2026, both on track, both addressing real scaling bottlenecks. And it just reclaimed its first green monthly candle in seven months.
At $2,200, you’re paying 55% less than investors did eight months ago for the same network with better infrastructure, more institutional adoption, and a clearer upgrade roadmap. Either Ethereum is structurally broken and the market is correct to price it here — or the fear has created an asymmetric opportunity that patient buyers will capitalize on.
The data leans toward the latter. But “lean” is not “guarantee” — which is why position sizing and risk management matter more than conviction.
FAQ
Is Ethereum dead?
No. Ethereum remains the most active blockchain for smart contracts, DeFi, and RWA tokenization. Developer activity continues, two major upgrades are scheduled for 2026, and institutional adoption is accelerating. The “Ethereum is dead” narrative resurfaces every bear market and has been wrong every time so far. The legitimate concern is competition from Solana and L2 cannibalization — but these are growth challenges, not existential threats.
Should I buy ETH or BTC right now?
BTC is the safer choice with stronger institutional backing and a better risk-adjusted profile. ETH offers more upside potential but carries more risk (narrative headwinds, ETF outflow streak, declining ETH/BTC ratio). A balanced approach: allocate 60-70% to BTC and 30-40% to ETH. If you must choose one, BTC is the more conservative play.
Will Ethereum reach its all-time high again?
In previous cycles, ETH has always surpassed its previous ATH — but it took 3-4 years after each peak. The $4,955 ATH was set in August 2025. Under the base case scenario ($2,800-$3,500 by year-end), ETH would not reach ATH in 2026. The bull case ($3,500-$5,000) puts it within range but requires multiple catalysts to align. A new ATH in 2027-2028 is more probable.
What makes Ethereum’s staking yield attractive?
The 3.5-4.2% staking APR provides a “risk-free rate” for the crypto ecosystem — a concept that doesn’t exist for Bitcoin. You can hold ETH and earn yield while waiting for price appreciation. The new staking ETFs from BlackRock and Grayscale allow institutional investors to access this yield through regulated products for the first time, potentially unlocking significant new demand.
What’s the biggest risk for ETH holders?
The biggest risk is a continued structural decline in the ETH/BTC ratio — meaning ETH underperforms BTC for another 12-24 months. If institutional capital continues to prefer BTC over ETH (as reflected in ETF flows), ETH could grind sideways even if the broader market recovers. The antidote is position sizing: don’t overweight ETH relative to BTC until the ratio shows signs of reversing.
Bottom Line
Ethereum at $2,200 is either a generational buying opportunity or a value trap — and which one it is depends largely on whether the current bearish narratives reflect permanent structural decline or temporary fear-driven mispricing.
The weight of evidence suggests the latter. Ethereum’s developer ecosystem, institutional adoption, RWA tokenization dominance, staking economics, and upgrade pipeline are all stronger than they were at the previous cycle bottom. But the headwinds are real: ETH ETF outflows, competition from Solana, a declining ETH/BTC ratio, and whale distribution suggest that patience is required.
The approach that balances opportunity and risk: DCA into ETH as part of a diversified crypto allocation (15-25%), secure your holdings in a hardware wallet, and set your exit targets before the market gives you a reason to change them. Watch the $2,000 support and $2,400 resistance — whichever breaks first will set the tone for the rest of 2026.
We update this analysis as conditions change. Bookmark and check back for the latest data.
Disclaimer: This article is for educational and informational purposes only and does not constitute financial advice. Cryptocurrency investments carry significant risk, including the potential for total loss. Always do your own research and consult a financial advisor before making investment decisions.